









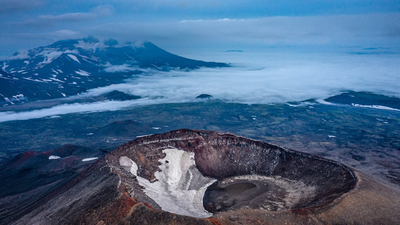
When a magnitude 8.8 earthquake ruptured a fault offshore from Russia’s Kamchatka Peninsula in 2025, it sent tsunami waves across the Pacific Ocean. Now researchers have shown that clues to where it would strike may have been sitting in ground-motion measurements collected years earlier. By reanalysing older satellite positioning records, a new study maps a major locked zone on the plate boundary that lines up with the rupture, along with smaller patches near the point where it began. The findings help explain why a comparable earthquake in 1952 unleashed a far more destructive tsunami. Here is what the study found.
Where the Pacific Plate slides beneath Kamchatka, the subduction zone behind two great earthquakes
Kamchatka, a peninsula in the northwest Pacific, marks the place where one tectonic plate dives beneath another. According to the study ‘Linking Interseismic Locking to Coseismic Rupture: The 2025 Mw 8.8 Kamchatka Earthquake’ published in Geophysical Research Letters by Axel Periollat and Gareth Funning, the Pacific Plate descends beneath a smaller piece of crust called the Okhotsk Microplate at roughly 80 millimetres a year, a little over three inches. That sloping contact surface, known as a megathrust, has produced two very large earthquakes in the instrumental era, a magnitude 9.0 event in 1952 and, about 73 years later, the magnitude 8.8 earthquake of 2025. That earthquake was also preceded by smaller foreshocks, a magnitude 7.1 nearly a year earlier and a magnitude 7.4 just days before. The authors describe the 2025 event as a new benchmark against which earlier models of the region’s hidden strain can be tested.
Locked fault zones explained: How tectonic plates stick together, store strain and release it suddenly
Plates do not glide past each other smoothly everywhere. The study explains that parts of a subduction fault can be locked by friction, so the plates stick while the surrounding rock slowly bends and stores elastic strain, much like a compressed spring. Over the decades to centuries between major earthquakes, which scientists call the interseismic period, that strain accumulates. Other portions of the fault creep, sliding without producing large earthquakes. Mapping which is which matters because locked areas outline where future ruptures could occur. Researchers do this with ground-based satellite positioning receivers, radar measurements from space and estimates of seafloor movement, then build computer models of the fault that reproduce what instruments record at the surface. Comparing those models with what happens during a real earthquake can reveal how a subduction zone is segmented and how it behaves.
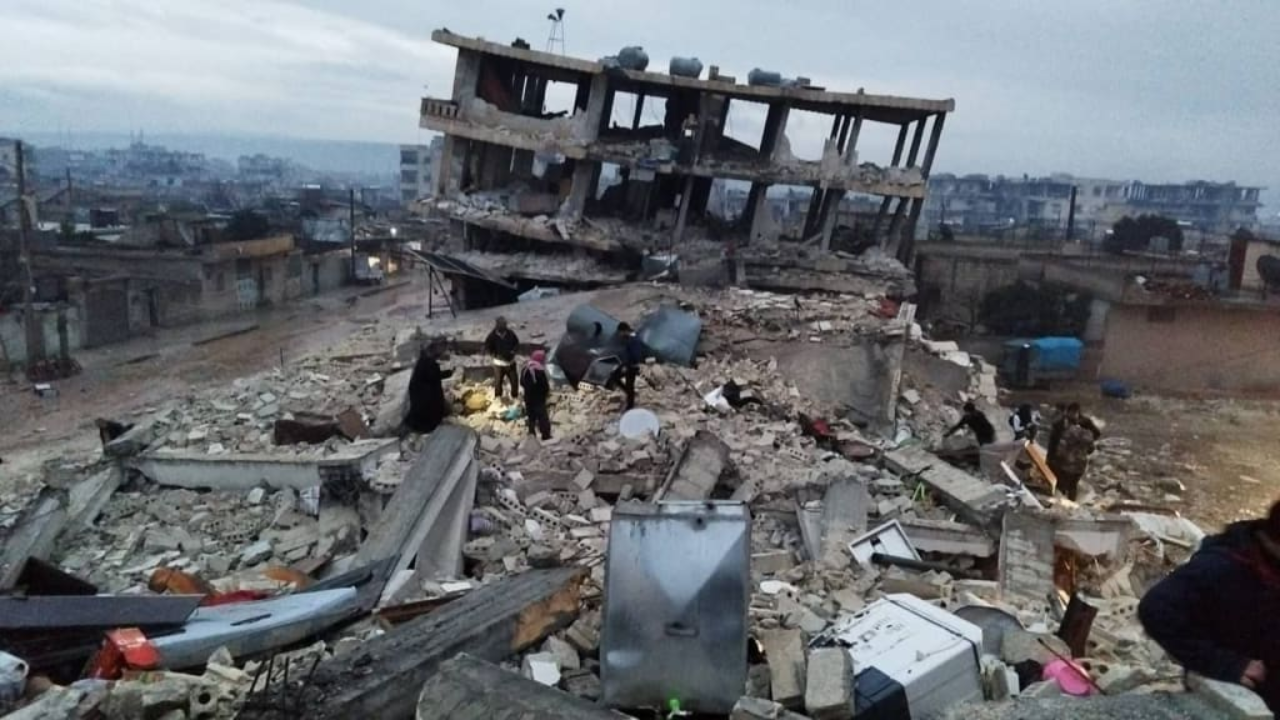
Hit by 8.8 magnitude earthquake (Image: Vocal Media)
Older satellite positioning data and how researchers mapped the locked zone
The team did not start with a map of where they expected trouble. Instead, they used horizontal ground-velocity measurements from satellite positioning stations on the peninsula, compiled in 2005 from receivers that ran continuously for more than four years and from survey stations observed annually between 2001 and 2003. They built a computer model of the fault surface using the Slab2.0 model of the plate interface, then let an algorithm decide which small fault elements were locked. Starting from about 2 percent of elements locked at random, one million independent runs of ten thousand steps each accepted or rejected changes based on how well the model matched the observed motion. Averaging all outcomes produced a probability of locking for every part of the fault.
A major locked zone beneath Kamchatka stored enough strain since 1952 to match the energy released in 2025
The headline result is a principal locked region made up of 618 fault elements, the largest of six high-probability areas the model identified. In the typical simulation, about 68 per cent of those elements, a median of 423, were locked, and locking probability dropped to low values at depths near 68 kilometres, which fits deeper parts of the fault sliding freely. Assuming plate motion of 80 millimetres a year over roughly 73 years, each locked element would have built up about 5.8 metres of slip deficit, or missing movement. Converted to earthquake size, that stored strain corresponds to magnitudes between 8.85 and 8.99, comparable to the 2025 earthquake’s magnitude of 8.84. Scaling by the typical locked fraction still recovers roughly 90 percent of the energy released in 2025, so the zone did not need to be fully locked.
Smaller locked patches near the starting point: Why earthquakes may begin at the edges of locked zones
Inside the large locked region, the authors used a statistical technique called hierarchical clustering to group fault elements that behaved alike across the million simulations. It split the zone into five sub-areas. The two most strongly locked, with average locking probabilities of about 0.98 and 0.88, lie close to where both the 1952 and 2025 earthquakes began, suggesting these patches may have started ruptures in more than one cycle. Locking only the first three sub-areas reproduced the observed ground motion almost as well as locking the whole region, so a fully locked block is not required. Two large foreshocks, including the magnitude 7.4 event days before the main earthquake, sit near the edges of the locked zone, consistent with rupture often beginning where stress builds fastest.
Why the 1952 earthquake caused a far more destructive tsunami than 2025
Slip, the distance the two sides of a fault move during an earthquake, tells the tsunami story. The authors compared their locking map with slip models for both events. They found the two earthquakes broke the same deep part of the fault, and the along-strike stretch of high slip looks similar, consistent with repeated failure of one long-lived asperity, a sticky patch on the fault. The difference lies near the trench, the shallow edge of the plate boundary. Tsunami-based models suggest the 1952 earthquake had much larger shallow slip, while the 2025 rupture concentrated deeper with limited shallow slip. The study notes that the 1952 tsunami, with wave heights of 15 to 18 metres in southern Kamchatka and the northern Kuril Islands, was more severe, whereas the 2025 tsunami reached up to about two metres on Hawaiian coasts.
Why 2025 slip locally exceeded the strain stored since 1952, and what the 1737 earthquake suggests
The study also uncovers a puzzle. At 80 millimetres a year, only about 5.8 metres of slip could have accumulated since 1952, yet slip in 2025 locally exceeded 20 to 30 metres. The authors suggest either that part of the strain was never released in 1952, or that other processes, such as slow ground adjustment after the 1952 event, reloaded the fault quickly. Settling it would need analysis of movement after the 2025 earthquake, which lies beyond this paper. Extending the interval to the roughly 215 years between a great 1737 earthquake and 1952 gives a plausible stored deficit equivalent to magnitude 9.1 to 9.3. Smaller earthquakes in between released negligible energy, so most strain is discharged in large megathrust events, the authors conclude.
What scientists still need to learn about the fault’s earthquake risk
The authors are candid about limits. Some high-probability patches north of 53 degrees latitude may be artifacts of the analysis, because they vanished when data from a single nearby station were removed, and a deep cluster at about 80 kilometres is likely a modelling edge effect rather than real locking. Earlier models by other researchers agree broadly but differ in the shape and depth of strongly coupled zones, showing how sensitive results are to method. Most importantly, offshore and shallow parts of the fault remain poorly resolved. The authors argue that seafloor geodesy, measuring ground motion on the ocean bottom, is needed to judge rupture and tsunami potential. The work was supported by an award from the National Aeronautics and Space Administration.